Here we explore the Critical Zone that encompasses the lowermost groundwater to the atmosphere that meets the earth. Exchanges between rock, water, soil, and living things that are critical to our sustainability. To understand the importance of this zone to us, this blog will focus on Critical Zone processes in Springfield, Ohio, our home.
With the data that we have collected you are able to look at
the behavior between time and scale of the Ohio River averages in the month of
September as well as Buck Creek and we then are able to look at the results
between the two. The Ohio River averages are [7g/km2/h], unlike that of Buck
Creek, which is at (0.62g/km2/h).
When looking at the data it is needed to be understood that
the Phosphate was collected at Buck Creek over a one day period. During this
day, many samples were taken at the site. There were two samples that were
collected at each of the 5 locations in the watershed we were studying, for a
total of 10 samples from the watershed.
The Ohio River data was collected over a span of 12 months,
for a 48 year time period from 1963-2011. Every sample was taken at the
beginning of the month. With those samples that were taken, we then just
focused on the month of September. The data was then looked at for every
September in the time period.
In conclusion, of all the data gathered from Buck Creek and
the other data collected from the Ohio River, one can conclude that the
differences in the scales vary due to size, space, location, and time of the
collection period in the different watersheds.
Mississippi River Watershed (rocketcare.utoledo.edu)
Nitrites are produced by a number of species of nitrifying bacteria in the absence of mineral nitrate sources, by means of various fermentation processes using urine and dung. Nitrates are mainly produced for use as fertilizers in agriculture because of their high solubility and biodegradability. The most prevalent nitrates are ammonium, sodium, potassium, and calcium salts. Several million kilograms are produced annually for the purpose of agricultural fertilization.
In most cases of excess nitrate concentrations in aquatic systems, the primary source is surface runoff from agricultural or landscaped areas that have received excess nitrate fertilizer. This process of excess fertilizer accumulating in aquatic ecosystems is called eutrophication and can lead to the sudden appearance of algal blooms. Because of the quick onset of floral growth, the ecosystem can develop water anoxia and dead zones, as well as the blooms causing other changes to ecosystem function, favoring groups of organisms better suited for the low oxygen content. Effectively, the excess of nitrate can change the makeup of aquatic biodiversity.
Upper Great Miami Watershed (epa.state.oh.us)
Fluctuations in dissolved nitrate present in waterways can vary depending on the scale of comparison. Within the small streams and rivers of Ohio,fluctuations in nitrate concentration may not be the most extreme. When looking at the data provided by the USGS concerning the Upper Great Miami watershed, we observed a small fluctuation in the minimum and maximum levels of nitrate being transported downstream (measured in g/km/hr). Below is a graph of the range (lowest to highest) and average hourly-area normalized yield of total N and total P for the Ohio River during the month of September based on all September averages:
When observing the fluctuations in the levels of dissolved nitrate transport in the waterways that the Upper Great Miami drain into, like the Ohio and Mississippi river, differences in the maximum and the minimum measurements differ much more drastically. The measurement of these waterways differ in this way because these large aquatic systems move water that had ran off of a much greater area of land. The amount of dissolved nitrate present is a result of many watersheds' water output compounding to create a highly concentrated volume when finally reaching the Mississippi River Delta and dumping into the Gulf of Mexico.
In looking at the
behavior between scales (time/scale) we discovered that the Ohio River averages
over the month of September was [7g/km2/h], unlike that of Buck Creek, which is
less than [1g/km2/h], at (0.62g/km2/h).
By looking at the
comparison of data, Phosphate collected at Buck Creek was collected over a time
period of 1 day. In that 1 day, we took two samples at every 5 spots within our
location in that watershed.
Ohio WaterShed
Buck Creek WaterShed
The data of the
Ohio River was over a span of 12 months, with samples being taken on the first
of each month from 1963- 2011 (48 years). When we narrowed that data down, we
chose the month of September. We had data from the 1st of September
for the years of 1963-2011.
So, from both our
own collection of data from Buck Creek, and the data that we found on the Ohio
River we can conclude that the differences in the scales vary due to size/space
and time of the collection period. ( sources for pictures Google maps) By : Shirley and Emilie
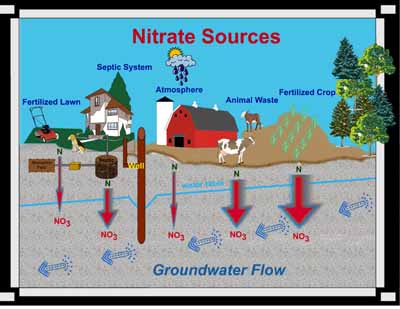
Nitrate (NO3) is a compound that is comprised of nitrogen and oxygen.
Nitrogen comes from decomposing organic materials like manure, plants, and
human wastes. Often the nitrogen (N) is derived from ammonia (NH3) or ammonium
(NH4).
Plant species need nitrogen to form amino acids and proteins, which are
essential for plant cell growth, but plants cannot use organic nitrogen
directly. Microorganisms in the soil convert the nitrogen locked in crop
residues, human and animal wastes, and compost to ammonium (NH4). Another specific
group of microorganisms convert ammonium to nitrate (NO3), and since nitrate is water soluble, excess nitrate not used by plants can leach
through the soil and into the groundwater.
The widths of the red arrows show relative
amounts of nitrate leaching into groundwater.
Nitrate is also present wherever biotic biproducts are breaking down or
decomposing like animal waste, and septic system absorption fields or mounds.
On Friday, October 12th, our class took a trip out to the Municipal Wetlands in Springfield, Ohio for various sampling procedures; one of which involved the concentration of nitrate in the ground water. We used varying techniques of water acquisition depending on the state of the water (standing, flowing, or ground). For standing and flowing water, we collected a predetermined volume of water in vials. Once the sample was collected, a chemical indicator was added to produce a color reaction corresponding to a concentration of nitrate in the water of that particular locale. Using the color wheel on the measuring device, the specific color-concentration reading was obtained. For ground water samples, an additional step was needed to be performed before the chemical indicator was to be added. First, the area of interest was cored, allowing ground water to flow into the new opening. The water was collected, solid particles were allowed to settle out until the above testing procedures involving the indicator and color comparison were done.
Below is a video demonstrating the nitrate testing site as well as techniques used:
Surface, Standing Water:
Ground Water:
Why sample nitrate?
Nitrate is a common contaminant found in many wells, wetlands, rivers, and other waterways. Shallow wells, wetlands, and streams in close proximity to agricultural land, and that collect runoff from cultivated land are the most vulnerable to nitrate contamination. Major sources of nitrate contamination can be from fertilizers, animal waste, and human sewage. The Environmental Protection Agency highly recommends testing drinking water supply on a regular basis. Elevated levels of nitrate in drinking water can cause Blue Baby Syndrome in infants under six months of age and that are bottle fed. Long term health effects to older children and normal healthy adults exposed to elevated levels of nitrate in their drinking water are not yet agreed upon in the scientific community. However, the National Cancer Institute suggests a link between elevated levels of nitrate in drinking water and an increased risk of non-Hodgkin's lymphoma (a cancer of the lymphatic system).
The Municipal Stadium Wetlands are a very important resource
for the Springfield and Wittenberg communities, as well as, a very beautiful,
peaceful and idyllic location that can be enjoyed by the Springfield and
Wittenberg communities. The Springfield community has certainly taken notice of
the Wetlands importance with a recent article in the Springfield News Sun,
about the wetlands and their value, in terms of a wetlands capacity to capture
pollutions and impurities. A link to the article mentioned is http://www.springfieldnewssun.com/news/news/local/stadium-wetland-keeps-creek-idea-alive/nSZ8q/.
However, as an individual who was born and raised in Springfield, I hope
that this beautiful and educational place can be maintained and kept clean and
welcoming, rather than attracting negativity. The Municipal Stadium Wetlands
must be maintained as a positive place, that allows positive individuals to gather
their without feeling unsafe or wary of their surroundings, because it is such
an important resource, as well as a very pleasant place where people can enjoy
nature.
Our Mission at the Wetland! ~ Our wetlands provide us with diversity of animal species and protect and filter our water. In the efforts to learn more about them, we have been collecting data of the pH levels of the water and also the temperature to see how this is related to the critical zone. By learning more we are able to take action and protect our wetlands. We tested the temperature using a YSI prob( which is described in the video below). (source: youtube.com)
source: youtube.com
~What is pH?
pH is defined as: Ameasureoftheacidityoralkalinityofasolution,numerically equalto7forneutralsolutions,increasingwithincreasing alkalinityanddecreasingwithincreasingacidity.ThepHscale commonlyinuserangesfrom0to14. ( dictionary.com)
Video explaining pH:
(Source: youtube)
Us testing pH levels at Wetland:
~What is Temperature?
Temperature is defined as:ameasureofthewarmthorcoldnessofanobjector substancewithreferencetosomestandardvalue.The temperatureoftwosystemsisthesamewhenthesystems areinthermalequilibrium. ( Temperature is very important to test because if the water is too hot then some species may not survive in the conditions. For example: in Buck Creek where we tested first, it is know for the trout because the water is at a cooler temperature.) Testing Temperature:
Overall Summation: ~ All these tests are very important in order to preserve and protect our wetlands.
The Municipal Stadium Wetlands were created by a levee failure in 1937. The levee break remained unfixed and the wetlands were created by subsequent inundation. Additional flooding was allowed in the last two years by the incision of a flood bank of Buck Creek that drains into the wetland. (This resulted from class project work by geology students working with Dr. John Ritter).
Dr. John Ritter and his students have installed instrumentation in the wetland to monitorchanges in water stage, pH, ORP, temperature, and turbidity (See Fact Sheet). There is interest in the site from the City of SpringfieldWetland Article by Tom Stafford
While the size of the wetland is small, nutrient (fertilizer) management continues to be a huge problem for the Mississippi River Basin. Low-cost mitigation options might include targeting riparian areas of streams like Buck Creek for additional innundation and wetland creation. This site is ideal for study becausewatersheds like the Upper Great Miami thathave among the highest nutrient loads (Combined Sewage Overflow & agricultural runoff).In fact, our class plotted data from a recent USGS study showing that the Great Miami is in the top 30 N and P loading watersheds of 800 that feed the Mississippi River basin and in the top 5 for watersheds in Ohio.
Geology of the Critical Zone is conducting a baseline study of the nitrate and phosphate concentrations in the wetlands during the drier period of the early fall. An upper-level projects class will conduct temporal sampling during the Spring Semester when the wetland will flood. This class will expand investigations of nitrate and phosphate and also examine chemical weathering (and its role in climate change). It is relatively unknown how mineral weathering is altered by the presence of wetlands, and yet this process regulated the earth's temperature over geologic timescales.
Buck Creek adjacent to the Municipal Stadium Wetland.