Saturday, September 28, 2013

Wittenberg Explores Soil Sustainability

For the last 2 weeks, my Geology of the Critical Zone class piloted the first NSF funded agricultural sustainability geoscience curriculum as a part  of InTeGrate. InTeGrate strives to create and widely disseminate interdisciplinary, student-centered (non-lecture) curriculum on sustainability.  Two other undergraduate cohorts at Virginia Tech (Dr. Hannah Scherer) and Santa Rosa Junior College (Martha Murphy) have and will pilot the same curriculum.  Our pilot goals are to identify improvements that will make our modules fit well with many institutional types and broadly illustrate the need for soil sustainability.  This week, after exploring soil properties that promote infiltration and reduce erosion,  we took a break and headed to Yellow Springs to visit the Antioch Organic Farm.  My class found that the tilled plot did not form surface aggregates (clumps) while the no-till plot did.  Only the water poured through the no-till soil remained clear and free of eroded soil.  This is not surprising. Globally, tillage contributes to erosion at rates that far exceed the production of soil and this disrupts the natural fertility of soil and ability to sustain our food and fiber resources. No till practices are one way to greatly reduce erosion rates. We are grateful to Marianthe Bickett, our gracious student tour guide at the Antioch Farm.  She showed us permaculture plots, where rotation of crops and animals is practiced, to reduce pests, improve nutrient management.  Food grown in the farm is part of the Antioch student's meal plan.  Thanks Marianthe!


Thursday, September 19, 2013

Sky Schelle's Visit! By: Ashley, Jordan & Alex

During  the city Stormwater Coordinator, Sky Schelle, visited our class in preparation for our evaluation of a vacant lot for a potential stormwater detention area. We learned that stormwater is a bath for the surface of the earth that flows into our storm system where it is combined with our sewage system (i.e a combined sewer). Depending on the age of the city sanitary waste and stormwater waste are either combined in the same underground pipe, or kept separate. Many older, impoverished areas have combined systems  that contribute storm overflow waste directly into rivers.  This is the case for Springfied, that contributes combined sewage overflow directly into Buck Creek during many storms. Stormwater treatment at plants is extremely expensive for cities to compensate. In Springfield, it might total $150 million to bury tunnels to hold excess water until treatment plants able to handle additional capacity. Fortunately, vacant lots might be a place where stormwater can be detained and landscapes restored.   Water health only improves if we treat water for wastes before it is released into local runoff spots including creaks, ponds, lakes.. One of Sky's purpose as a stormwater coordinator is to consider ways to reduce sewage overflow. One way to reduce the need for buried tunnel capacity, is to is to restore vacant landscapes to detain stormwater runoff. Land might be re-purposed in community beautification project and creating catch basins, such as rain gardens or wetlands, to catch storm water until it has time to be properly treated.


Source: Watershed Coalition River des Peres, Missouri
Caption: This is a depiction of dry vs. wet weather flow of wastewater and the treatment of combined sewer pollution.


Source: Street Stormwater Drainage Project
Caption: This image serves as a improvement method example for cities to implement community beautification projects to provide basins for excess storm water. 

Lumpkin rain garden


* This post has been edited by Dr. Fortner.

Tuesday, September 17, 2013

Stormwater Wetlands! By: Carli, Marley, & Melissa


Stormwater wetlands are created to slow down the movement of water during storms or snow melt and to reduce the flooding in the surrounding areas. These wetlands, although they contain less biodiversity than natural wetlands, are capable of removing pollutants that contaminate the stormwater. Pollutants removed include: heavy metals, pesticides, fertilizer, oils. This is important because it reduces contamination to nearby water. Nutrient removal is especially important because, nutrient pollution in ponds, lakes, or rivers creates excess algae growth.  The  death and decay of excess algae can reduce oxygen and create dad zones where many stream organisms die.

Sources: Department of Ecology State of Washington 


Source: Carli, Marley, Melissa

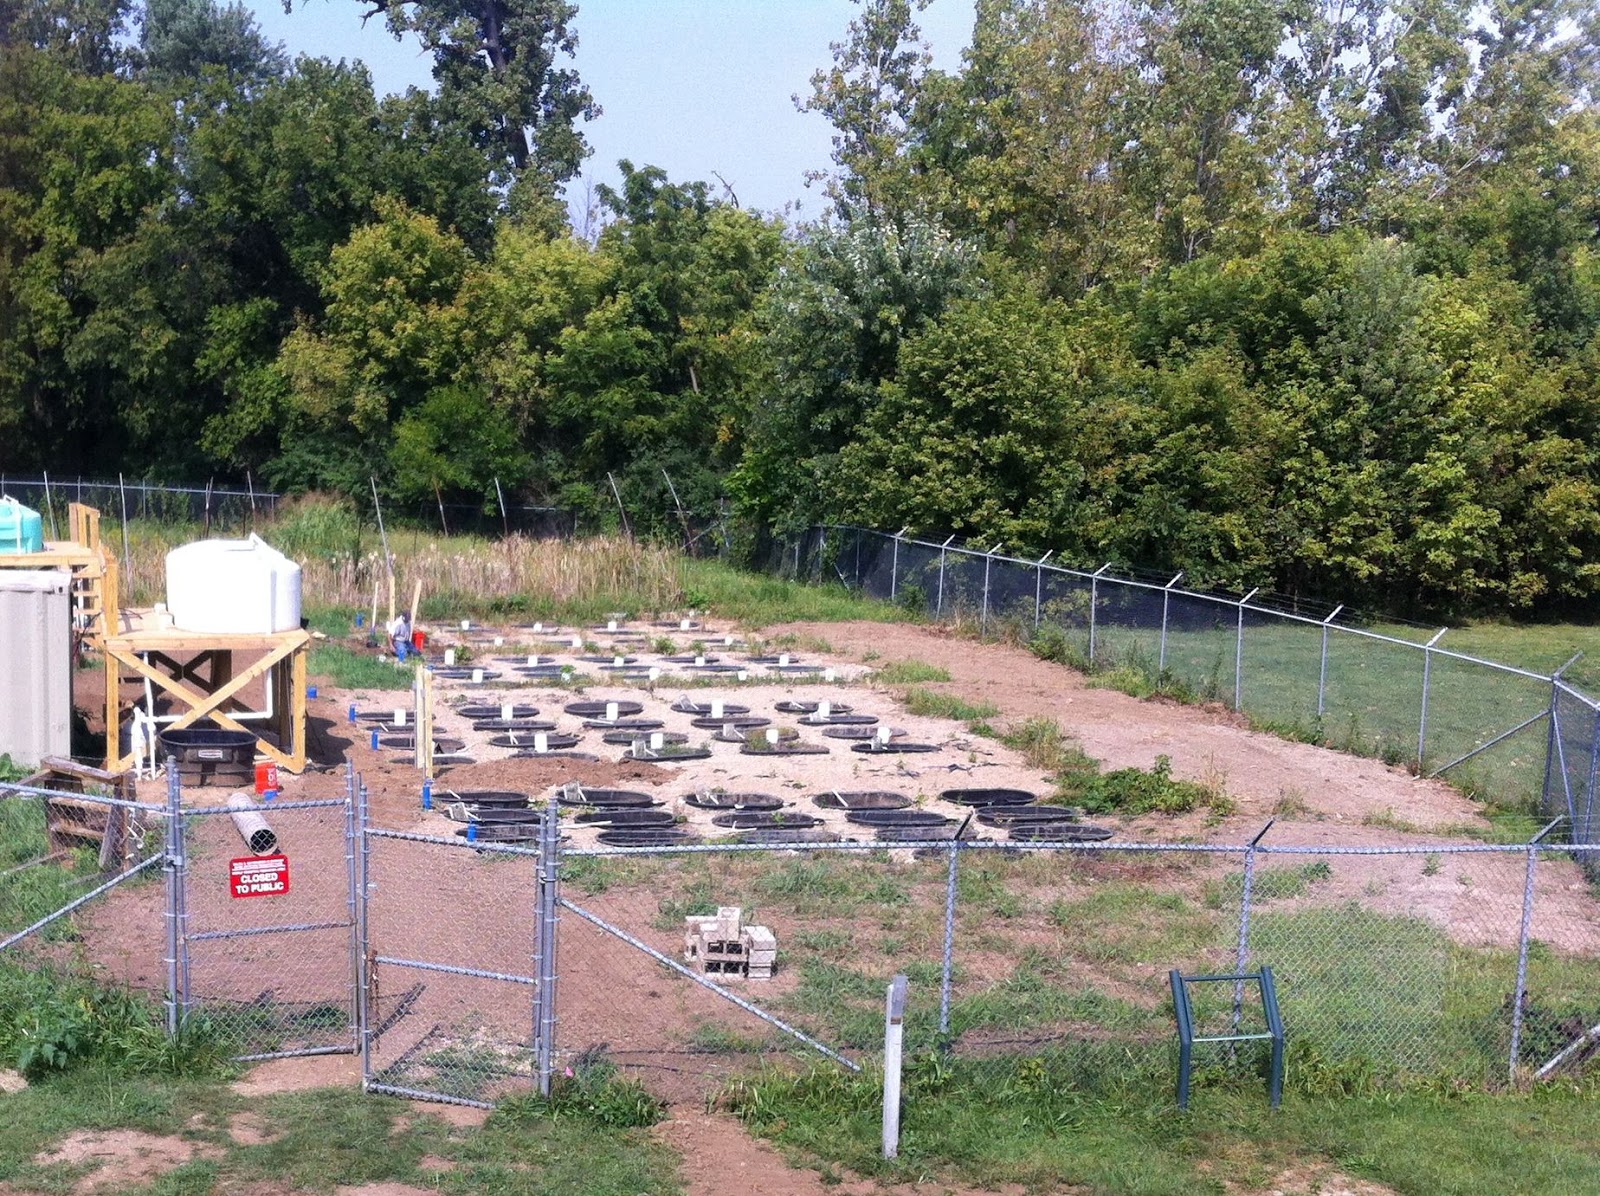
Captions:  Picture of Experimental Wetland 1 at Olentangy River Wetland Research Park. 


Source: Stefanik, Kay C., Mitsch, William J. Science Direct: Ecological Engineering. Volume 39, February 2012.

This chart shows a few different wetlands and the relationship between their levels of diversity and their productivity. As you can see, the Olentangy River Wetlands are one of the highest functioning wetland habitats that have a high level of diversity and productivity.


Source: Marley, Melissa, Carli Swartz
Caption: View of an wetland outflow at the Olentangy River Wetland Research Park.  

Friday, September 13, 2013

Olentangy Experimental Wetland Park Trip

On Wednesday, September 11th, 2013 we visited the Olentangy Experimental Wetland Park, at the Ohio State University Campus.  There we thought more about the function and services of wetlands (their ability to remove sediment and nutrients) and we saw some of the research plots and equipment that have been used at this site for over 2 decades.  This trip gave us a glimpse at the potential for water quality improvement in our own watershed, Buck Creek, with possible urban wetlands in vacant lots.


Experimental plot of 'mini' wetlands that can be used for reproducibility studies

The inflow to the experimental wetlands in the Olentangy River (powered by solar).

Lowhead dam looking down at the flooded woodlands that have been restored.  The dam is below the inflow into the experimental wetland and impairs water quality (traps sediment, lowers oxygen)

Eddy flux tower to monitor greenhouse gas emissions in the experimental wetlands.

This 'dock' is actually the way to measure sediments that accumulation.  

Brave Geology of the Critical Zone students walking out over the narrow walkway.

Friday, September 6, 2013

Forcings of Springfield ohio by; Erin Murray, Ashley Milliner, and Carli Swartz

The forcings around the Springfield area are as follows:


  • Climate
    • Springfield Ohio Cycles through four full seasons and experiences a wide range of temperatures and kinds of precipitation. 
    • As the graphs and data above indicate, these are the average low and high temperatures for each month that springfield experiences. The graph also includes a bar graph of the amount of precipitation that Springfield experiences each month.
  • Human Activity 
    • Human activities influence the landscape in many ways.  Some of these activities include: roads, power transmission lines, pipelines, and power dams.  Temporary landscapes, could be forests, used for harvesting.  Depending on vegetation, this could either attract animals or make them migrate to other areas.  Animals can have an impact on human activities.  
  • Tectonic: 
    • During the Cambrian period (530 million years ago) Ohio was covered in a sea.  Fast-forwarding 100 million years later, Ohio was still covered by a shallow sea, mainly eastern Ohio.  Ohio has remained in the tropical climate; the climate is why sedimentary rocks have formed.  Sedimentary rocks are rocks that have formed from deposition of material, within a body of water.  
    • In the past several years Springfield's tectonic plates have been more active than usual. There were 8 recorded earthquakes in 2010, four in 2009, and five in 2008 were recorded as well. These aftershocks have been very minor earthquakes and have been recorded in the 2-3 range on the seismic scale. The quakes have led our city to be slightly shaken but no real damage has occurred. The city does have some sloped hills that have been made by previous earthquakes happening in this area as well. 

Work Cited: 
  • http://www.enr.gov.nt.ca/_live/pages/wpPages/soe_landscape_changes.aspx
  • http://www.usclimatedata.com/climate.php?location=USOH0908
  • http://criticalzonespringfield.blogspot.com/2013/09/tectonic-history-of-ohio.html

How the Climate of Ohio is Being Effected by Humans

Climate of Ohio (1901-2010)


Temperature

Below you will see two graph of the temperatures of Ohio from 1901-2010. One graph is the average temperature in April and the other in December. Although these graphs only show 110 years, you can see a steady rise in temperature, especially in April, but also in December. This steady rise in temperature could be due to several things, such as anthropogenic causes (coal burning).


www.ncdc.noaa.go


In this pie chart you can see the amount of dangerous gases produced from global green house emissions.

http://www.epa.gov/climatechange/ghgemissions/global.html

The use of fossil fuels results in large amounts of Carbon Dioxide emissions which causes rises in temperature on land and on sea. 

http://blog.heartland.org/wp-content/uploads/2013/03/1-s2.0-S0921818112001658-gr3.jpg

Carbon Dioxide is released in almost everything that humans rely on. This is apparent in the pie chart below. 


-Alex, Jordan, Marley

Thursday, September 5, 2013

Tectonic History of Ohio

For much of its geological history Ohio has remained within the tropics (approx. ±23° latitude). By the late Cambrian period (approx. 530 million years ago), Ohio was covered in a sea and would stay that way until the end of the Ordovician period (505 million years ago). Plate tectonics had shifted Ohio from being about 10° South latitude to 20° South.

During the Devonian period (410-360 million years ago) warm, shallow seas covered parts of Ohio, especially eastern Ohio. The area had shifted north and then existed around the Equator during this period. The picture included below shows the topography of Ohio and location of the shallow seas during the Devonian period (image source). The shales that cover eastern Ohio were created from the sediments that deposited in this period.


The United States during the Devonian period (approx. 410-360 million years ago)

In the late Mississippian period much of Ohio was once again covered by shallow seas. These warm, shallow seas deposited lime sediments that are seen at the surface of northwestern and east-central Ohio. As for the surface rock in Springfield (in central Ohio), much of it was created during the Devonian period. The rocks at the surface are composed of the sedimentary rocks limestone, dolomite, shale, and sandstone, which deposited from erosion.

In summary, for much of the geological record Ohio has remained in tropical climates. This tropical climate has impacted the conditions under which the sedimentary rocks in Ohio have formed. Plate tectonics have shifted Ohio northward only in relatively recent geologic history– by the Quaternary period most of Ohio was covered by glaciers.

Source