Wednesday, November 28, 2012

Phosphate - Scale


With the data that we have collected you are able to look at the behavior between time and scale of the Ohio River averages in the month of September as well as Buck Creek and we then are able to look at the results between the two. The Ohio River averages are [7g/km2/h], unlike that of Buck Creek, which is at (0.62g/km2/h).


When looking at the data it is needed to be understood that the Phosphate was collected at Buck Creek over a one day period. During this day, many samples were taken at the site. There were two samples that were collected at each of the 5 locations in the watershed we were studying, for a total of 10 samples from the watershed.


The Ohio River data was collected over a span of 12 months, for a 48 year time period from 1963-2011. Every sample was taken at the beginning of the month. With those samples that were taken, we then just focused on the month of September. The data was then looked at for every September in the time period.
In conclusion, of all the data gathered from Buck Creek and the other data collected from the Ohio River, one can conclude that the differences in the scales vary due to size, space, location, and time of the collection period in the different watersheds.

- Zach Smith & Stefan Latham


Sunday, November 18, 2012

Nitrate Behavior - A Scalar Comparison

 
Mississippi River Watershed (rocketcare.utoledo.edu) 
 
Nitrites are produced by a number of species of nitrifying bacteria in the absence of mineral nitrate sources, by means of various fermentation processes using urine and dung. Nitrates are mainly produced for use as fertilizers in agriculture because of their high solubility and biodegradability. The most prevalent nitrates are ammonium, sodium, potassium, and calcium salts. Several million kilograms are produced annually for the purpose of agricultural fertilization.

In most cases of excess nitrate concentrations in aquatic systems, the primary source is surface runoff from agricultural or landscaped areas that have received excess nitrate fertilizer. This process of excess fertilizer accumulating in aquatic ecosystems is called eutrophication and can lead to the sudden appearance of algal blooms. Because of the quick onset of floral growth, the ecosystem can develop water anoxia and dead zones, as well as the blooms causing other changes to ecosystem function, favoring groups of organisms better suited for the low oxygen content. Effectively, the excess of nitrate can change the makeup of aquatic biodiversity.
Upper Great Miami Watershed (epa.state.oh.us)
 
Fluctuations in dissolved nitrate present in waterways can vary depending on the scale of comparison. Within the small streams and rivers of Ohio,fluctuations in nitrate concentration may not be the most extreme. When looking at the data provided by the USGS concerning the Upper Great Miami watershed, we observed a small fluctuation in the minimum and maximum levels of nitrate being transported downstream (measured in g/km/hr). Below is a graph of the range (lowest to highest) and average hourly-area normalized yield of total N and total P for the Ohio River during the month of September based on all September averages:


When observing the fluctuations in the levels of dissolved nitrate transport in the waterways that the Upper Great Miami drain into, like the Ohio and Mississippi river, differences in the maximum and the minimum measurements differ much more drastically. The measurement of these waterways differ in this way because these large aquatic systems move water that had ran off of a much greater area of land. The amount of dissolved nitrate present is a result of many watersheds' water output compounding to create a highly concentrated volume when finally reaching the Mississippi River Delta and dumping into the Gulf of Mexico.
 
 
- Evan Amstutz

Tuesday, November 13, 2012

Phosphate Behavior Comparison


In looking at the behavior between scales (time/scale) we discovered that the Ohio River averages over the month of September was [7g/km2/h], unlike that of Buck Creek, which is less than [1g/km2/h], at (0.62g/km2/h).

By looking at the comparison of data, Phosphate collected at Buck Creek was collected over a time period of 1 day. In that 1 day, we took two samples at every 5 spots within our location in that watershed.

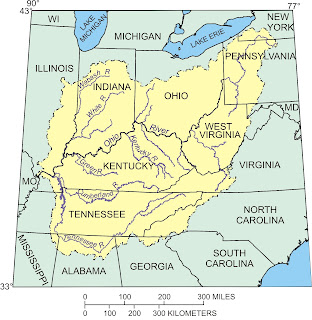
Ohio WaterShed

Buck Creek WaterShed

The data of the Ohio River was over a span of 12 months, with samples being taken on the first of each month from 1963- 2011 (48 years). When we narrowed that data down, we chose the month of September. We had data from the 1st of September for the years of 1963-2011.
So, from both our own collection of data from Buck Creek, and the data that we found on the Ohio River we can conclude that the differences in the scales vary due to size/space and time of the collection period. ( sources for pictures Google maps)

By : Shirley and Emilie